# Monitoring
Monitoring lets Bespoken automatically run your test suites on a defined schedule and alert you when failures are detected. This helps you catch regressions early and ensure your system stays stable between manual test runs.
# Supported Platforms
Monitoring works across all your supported platforms, providing a unified way to keep an eye on your systems, whether it's an IVR, web chatbot, or any other integrated platform.
# Enabling Monitoring
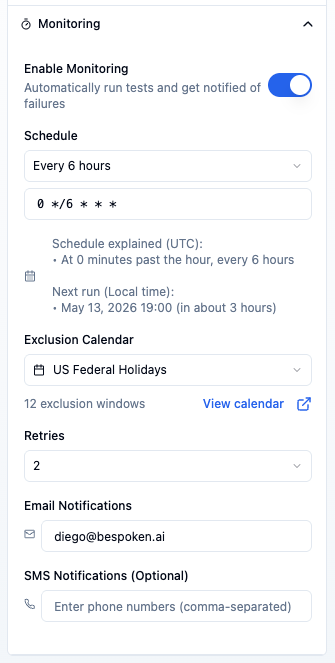
To enable monitoring, open the test suite you want to monitor, expand the Monitoring section in the configuration panel on the left, and toggle Enable Monitoring on.
# Schedule
Once monitoring is enabled, select how often you want the tests to run:
| Option | Frequency |
|---|---|
| Every 30 minutes | */30 * * * * |
| Every hour | 0 * * * * |
| Every 6 hours | 0 */6 * * * |
| Every 12 hours | 0 */12 * * * |
| Every day | 0 0 * * * |
| Every week | 0 0 * * 0 |
The CRON expression field is always visible below the dropdown. A plain-English explanation of the expression (e.g., "At minute 0 past every 6th hour") is shown automatically to help you verify the schedule is correct.
Custom Schedules
Users on paid plans can type any valid CRON expression directly into the field to set a fully custom schedule.
Trial Limits
Schedules shorter than 6 hours (Every 30 minutes and Every hour) are not available during a trial.
Timezone
All CRON expressions are evaluated in UTC. Please account for your local timezone when configuring a schedule.
# Exclusion Calendar
You can optionally attach an exclusion calendar to pause monitoring during scheduled maintenance windows, public holidays, or other known downtime periods. Select a calendar from the Exclusion Calendar dropdown in the monitoring configuration panel — scheduled runs that fall within any defined window will be skipped automatically.
See Exclusion Windows for instructions on creating and managing calendars.
# Retries
Use the Retries dropdown to configure how many times Bespoken should re-run the suite if it fails before sending a notification:
| Value | Behavior |
|---|---|
| 0 (disabled) | Notify on first failure |
| 1 | Retry once before notifying |
| 2 | Retry twice before notifying (default) |
| 3 | Retry three times before notifying |
Retries help reduce false positives caused by transient network errors or temporary platform issues.
# Notifications
Configure who gets alerted when a monitored test suite fails:
- Email Notifications — Enter one or more comma-separated email addresses. Recipients receive an alert whenever the suite reports a failure after all retries are exhausted.
- SMS Notifications (optional) — Enter one or more comma-separated phone numbers to receive SMS alerts in addition to email. Numbers should not have dashes, spaces, or parentheses; plus signs for international numbers are allowed.
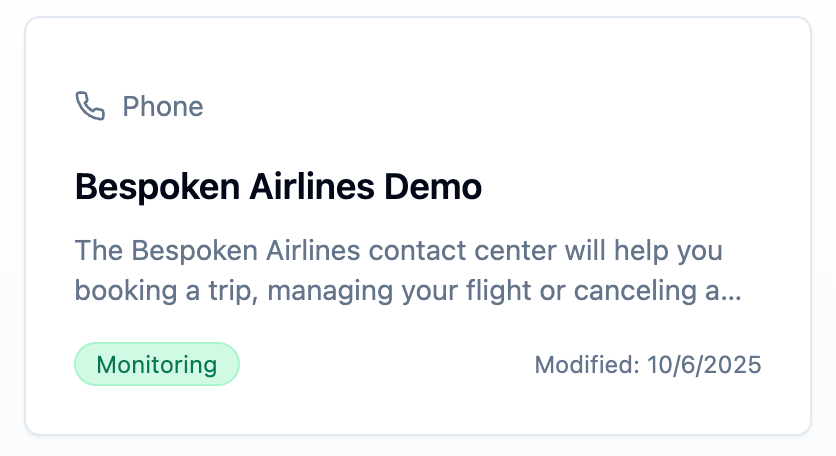
Once configured, your tests will run automatically at the specified intervals. You will also see a green monitoring pill next to your test suite name for suites that are being monitored.
Utterance Usage
Each scheduled test run consumes utterances from your plan. Choose a schedule frequency that balances the need for regular checks with your plan's limits.
# Test Execution and Notifications
Monitoring runs all tests within your test suite. This can impact the time it takes to run the tests and the number of utterances used.
- Use the "only" or "skip" flags to select or exclude specific tests, as explained here.
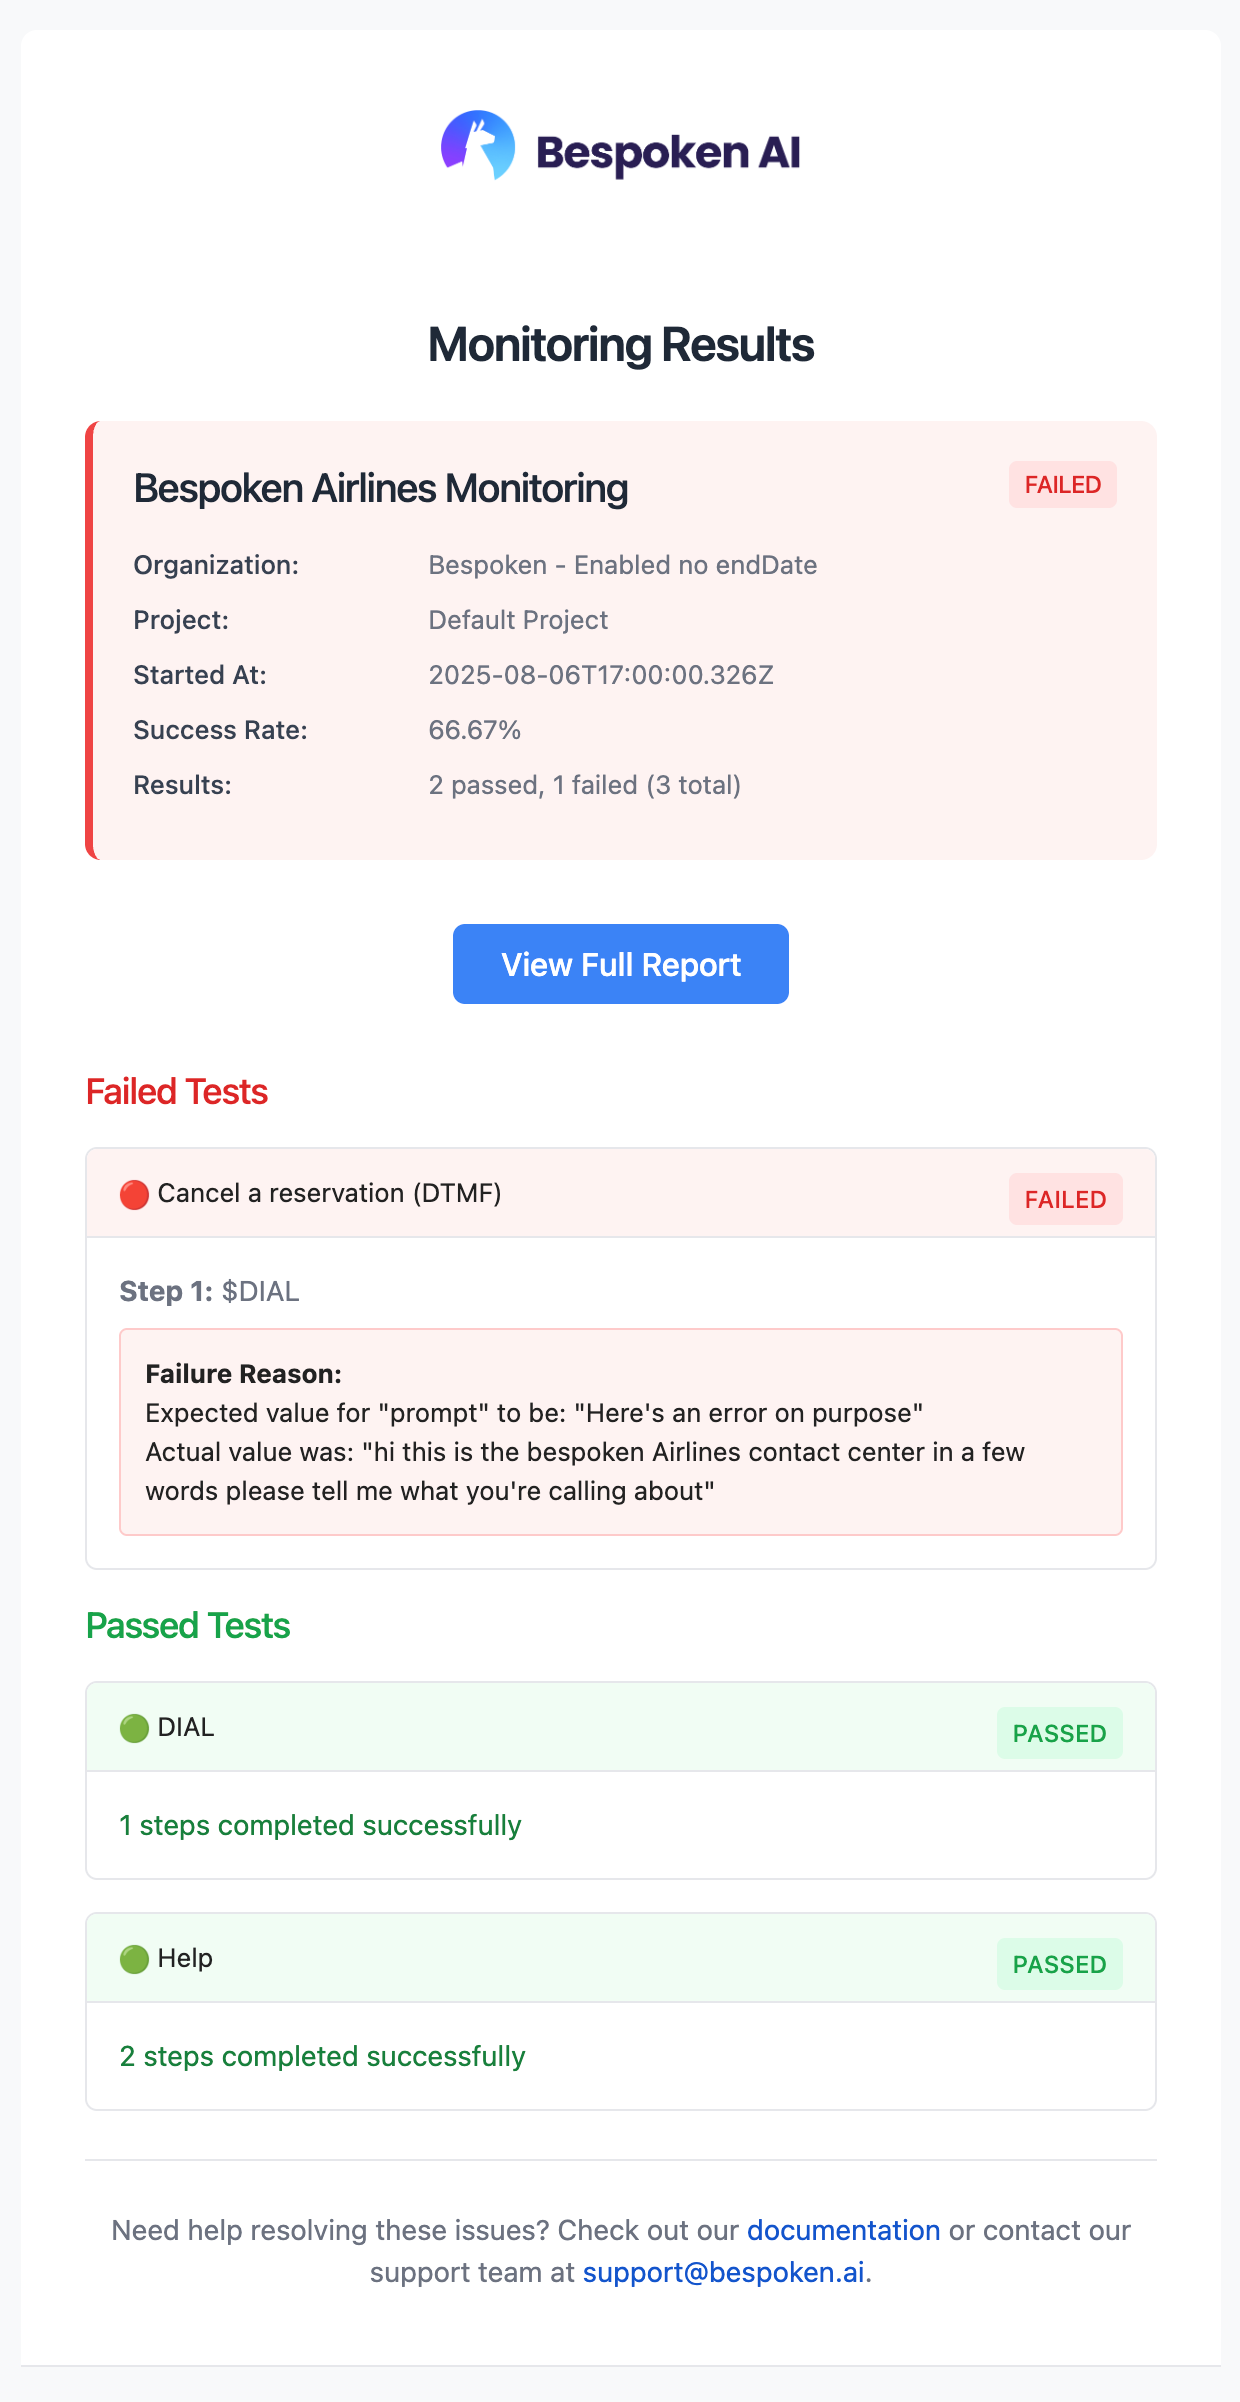
- If the test run succeeds, no notifications are sent.
- If the test run fails, an email is sent to the specified addresses with details of the run and a link to the history page where you can review the results.
# Monitoring Overview
The Monitoring page (accessible from the main sidebar) gives you a single view of all test suites currently being monitored across your projects.
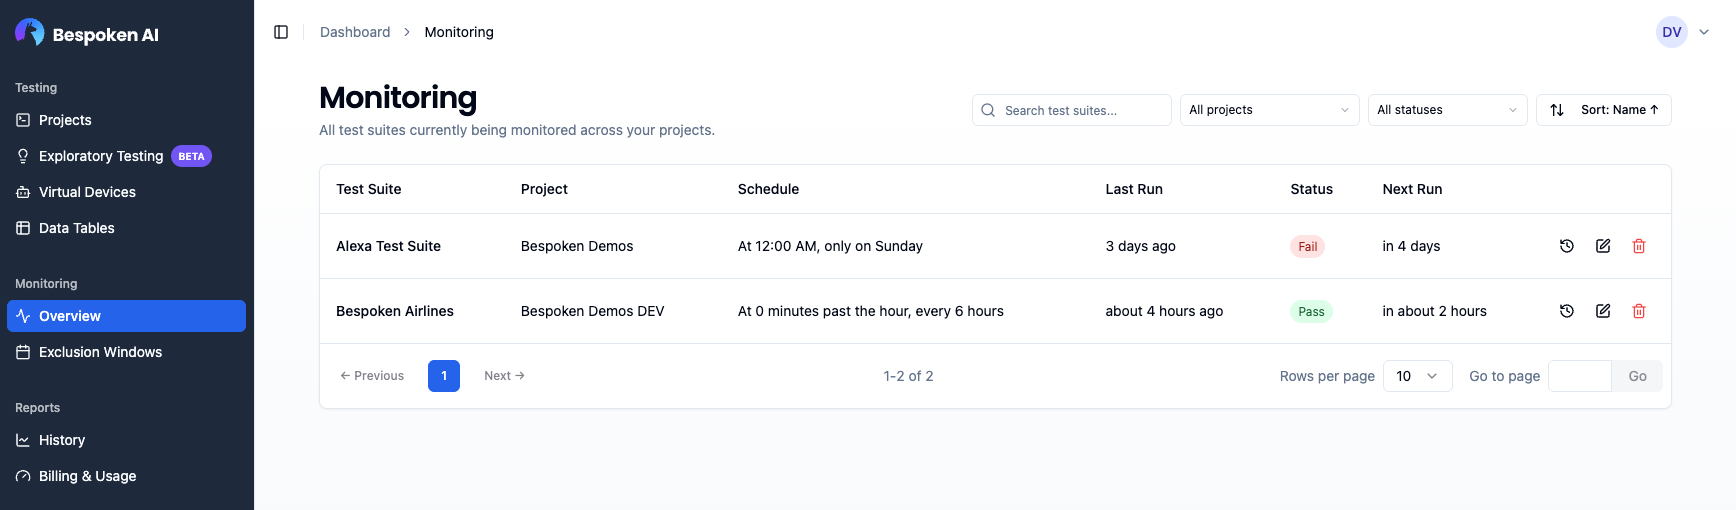
The table includes the following columns:
| Column | Description |
|---|---|
| Test Suite | Name of the monitored suite, links to the suite editor |
| Project | Project the suite belongs to |
| Schedule | Human-readable description of the CRON schedule |
| Last Run | Relative time of the last run; links to the run detail page |
| Status | Result of the last run: Pass, Fail, or Pending |
| Next Run | Estimated time until the next scheduled run |
# Filtering and Sorting
Use the controls in the top-right corner to narrow down the list:
- Search — Filter by test suite name.
- Project — Show only suites from a specific project.
- Status — Filter by last run status: Passing, Failing, or Pending / Not run.
- Sort — Sort by name, project, last modified date, last run date, or status.
# Actions
Each row has three action buttons:
- History — Opens the run history filtered to this test suite.
- Edit — Opens the monitoring settings dialog where you can update the schedule, exclusion windows, retries, and notification recipients.
- Disable — Removes monitoring from the associated test suite.
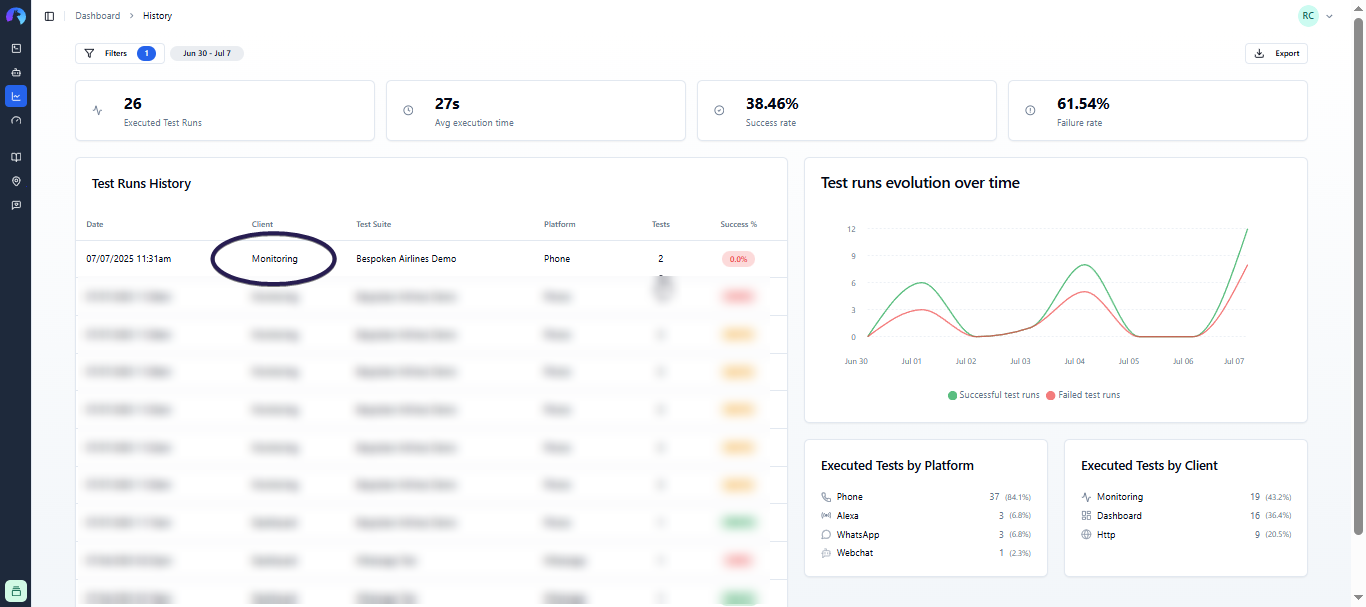
# Viewing Results
The results of monitoring runs are shown on the history page. When a test run is triggered by monitoring, the Client column displays "Monitoring".